Why your data is only as good as your data strategy

‘Data strategy’ is one of the latest in a long line of data-related buzz words, along with ‘data lake’, ‘big data’, ‘data mining’… But as with most buzz words, it is not always understood, so what is a data strategy? Simply put, it encompasses everything to do with data; from identifying the benefits potential data points may have, to its subsequent collection, storage and usage.
In the first blog about appreciating data, I went through the benefits of collecting data from Connected Homes. In this blog, I’m now going to focus on the subsequent analysis; why it’s necessary and how it is done.
—————————————————————————–
Why do you need a data strategy?
HomeLINK typically recommend installing 3 environmental sensors in each home. Imagine the volume of data that this produces in just a modest number of homes!
And this is just the beginning of the Connected Home. In the future, this list will grow to include devices that housing providers require better visibility of, which we envisage will include battery storage, assisted living solutions, ventilation devices to improve indoor air quality and many, many more.
If you were to install IoT devices in your own home, it would be feasible for you to also inspect that data – a simple graph with the temperature and humidity of your home would be enough for you to spot patterns, identify trends and act accordingly; whether that be improving the ventilation in your home or leaving the extractor fan on for a few minutes after cooking, for example. (This, by the way, is exactly why we developed our Residents App – enabling tenants to see their own homes data and empowering them to improve their own health and wellbeing. But that’s for another blog!)
When considering this volume of data across a portfolio of properties, that analysis soon becomes infeasible. What’s more, analysis on a house-by-house basis doesn’t maximise the utilisation of the statistics because it misses out any direct comparisons between properties.
—————————————————————————–
The amount of data we produce is only going up

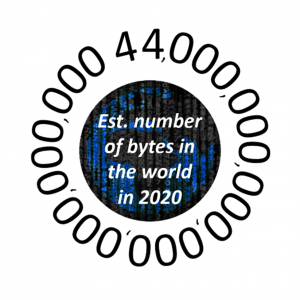
There are an estimated 7 billion IoT devices around the world right now and that number is estimated to reach 125 billion by 2030. At the start of 2020, it is estimated that the digital universe consisted of 44 Zettabytes, or 44,000,000,000,000 Gigabytes! All of this goes some way to explaining the need for an automated way of systematically analysing everything we collect to identify trends, outliers and anomalies which can then be distributed as alerts to provide value that would otherwise remain locked within the data. We call this ‘Data Science’.
—————————————————————————–
HomeLINK leading the way
HomeLINK is at the forefront of Data Science, with world-renowned experts in Artificial Intelligence (‘AI’) and Machine Learning (‘ML’) in our team. Combine this with our market-leading software that makes amassing data from various sources easy and produces a single pane of glass approach to visualisation, HomeLINK can be your partner in creating a data strategy for your housing stock. By doing so, you can ensure you are truly unlocking the value that ‘big data’ promises to provide.
In my next blog, I will take a look at the different trends and scenarios our AI looks out for to deliver what we refer to as ‘Insights’.
by Jordan Toulson, Product Manager at HomeLINK

Jordan is a self-confessed geek and can often be found roaming the countryside with his dog, Pippa.


